|
FMRI investigation of cross-modal interactions in beat perception: Audition primes vision, but not vice versa
Grahn, Henry, & McAuley, 2011
|
| ||||||
Beat perception rarely occurs in visual sequences. Even if a regular auditory rhythm that feels like it has a beat is translated into the visual domain, it will not feel like it has a beat.
In this study, we had people listen to or watch rhythms, and measured their beat perception. As expected, we found much lower beat sensitivity in visual sequences than auditory sequences (even though the sequences were temporally identical). However, visual beat sensitivity was increased by exposing participants to the auditory sequences beforehand. If they listened to the rhythms first, sometimes they could feel the beat in the visual rhythms.
Based on previous work, we hypothesized that the basal ganglia would play a key role in forming the internal representation of the beat when the rhythms were heard, and that this representation could be re-invoked when watching visual sequences, leading to visual beat perception. To investigate these, participants listened to auditory sequences or watched visual sequences in separate sessions while having fMRI brain scans. Some participants had auditory sessions followed by visual sessions, others had visual followed by auditory. Then we compared how each groups' brain responded during their visual sessions. For the group that had heard the auditory rhythms already, increases in bilateral putamen activity were observed during the visual sessions. The group that had not yet heard the auditory rhythms did not show this activity when watching rhythms. No such order-dependent differences (behavioural or neural) were found for the auditory sequences (that is, watching a rhythm didn't have any effect on how it was heard). The results support the role of the basal ganglia in internal generation of the beat, and provide evidence of a basal ganglia-mediated mechanisms for cross-modal influences.
Figure 1.
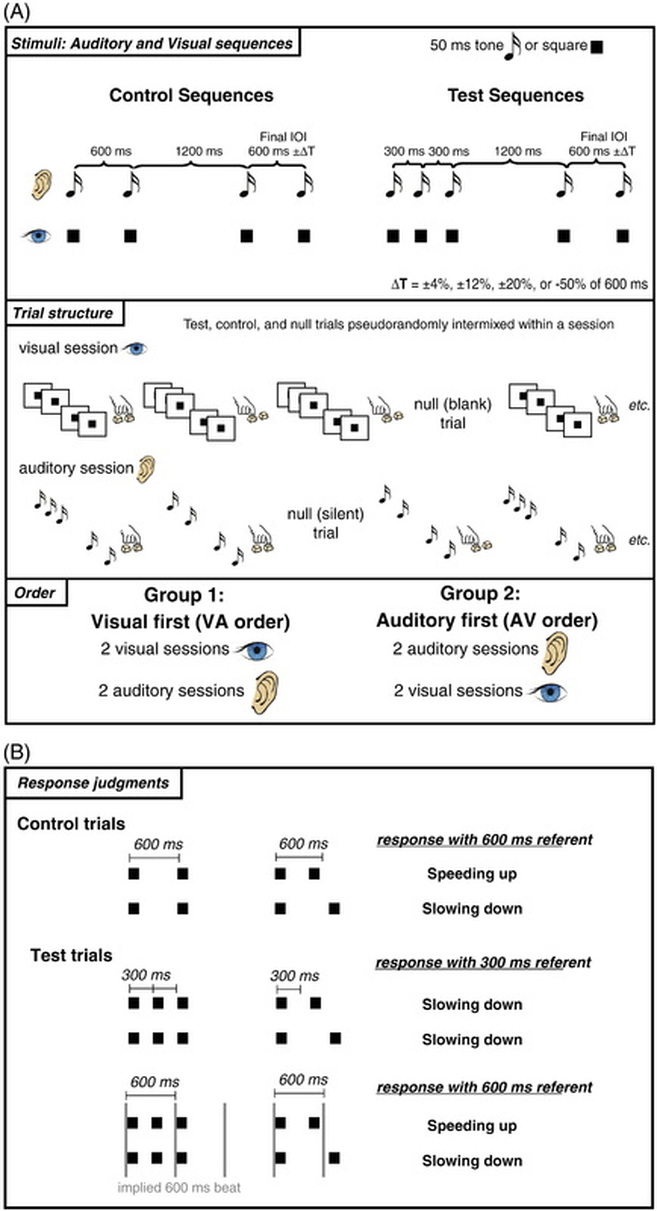
Tempo judgment paradigm: (A) Illustration of control and test sequences and design summary. Control sequences comprised four elements and test sequences comprised five elements. Sequence elements were marked by tones in the auditory condition and squares in the visual condition. Participants were divided into two groups: half received two sessions in the auditory modality followed by two sessions in the visual modality (AV order), the other half received two sessions of visual followed by two sessions of auditory (VA order). Control and test sequences were randomly intermixed within each session. (B) Task and typical pattern of responses to control sequences and pattern of responses to test sequences when the implied beat is perceived and when the implied beat is not perceived. For control sequences, speeding up or slowing down judgments are made relative to the explicitly heard or seen initial 600-ms interval. For test sequences, judgments can be made relative to the explicitly heard or seen 300-ms initial intervals, or to an implied 600-ms interval. The 600-ms referent is only used when individuals perceive a steady “beat” that is implied by the temporal structure of the test sequences (Grahn & and McAuley, 2009).
Figure 2.
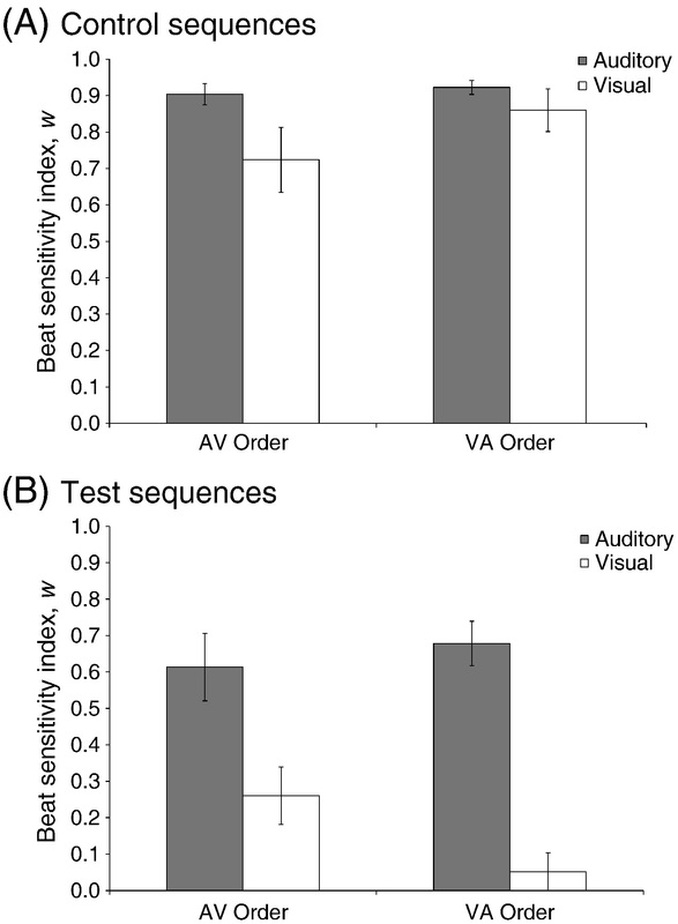
Average values of the beat sensitivity index, w, for AV and VA orders for auditory and visual modalities; w values are shown separately for control (Panel A) and test (Panel B) sequences. For control sequences, w values are not affected by order. For test sequences, there is a significant interaction between modality and order, caused by an increase in w for the visual condition in the AV order relative to the VA order. Error bars represent standard error.
Figure 3.
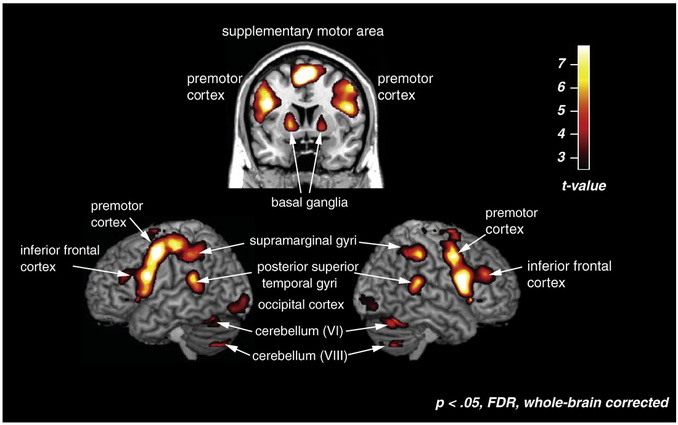
Areas that were significantly active in the conjunction of auditory-rest and visual-rest, pFDR < 0.05, whole-brain corrected.
Figure 4.
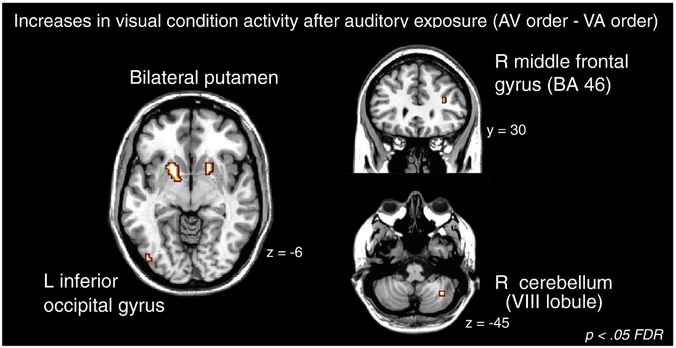
Brain areas with significantly greater activity during the visual condition in the auditory-first order compared to the visual-first order (auditory-first visual condition–visual-first visual condition) at pFDR < 0.05, whole-brain corrected. The image is masked by the F-contrast of the interaction between modality and order at p < 0.001 uncorrected to exclude any non-specific order-related differences that were present in both modalities; y and z indicate position in stereotaxic coordinates.
Figure 5.
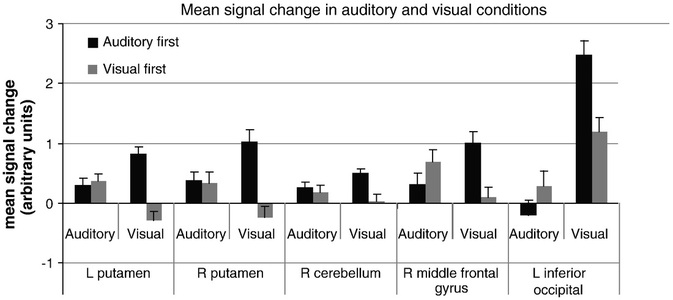
Mean signal intensities extracted for the brain areas showing significantly greater activity during the visual condition in the auditory-first order compared to the visual-first order.
Figure 6.
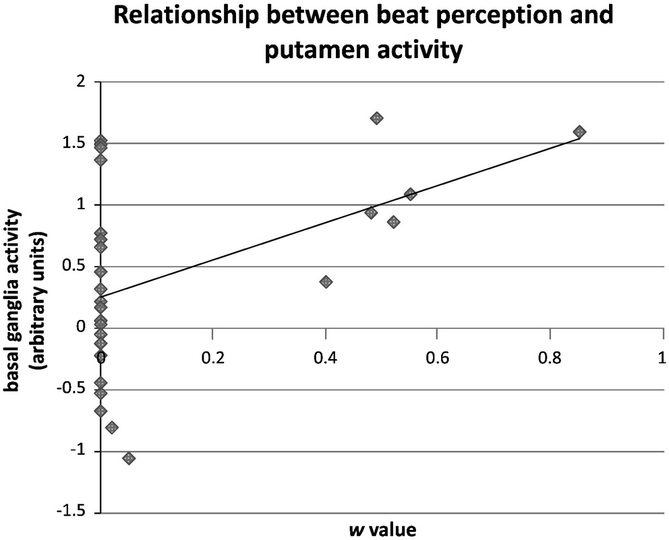
A scatterplot showing average bilateral putamen activity and w values from the visual session during fMRI.